Creating a LoRA Model for a Product
The goal of this workflow is to create a specific LoRA model for the Adidas Gazelle shoes, capable of generating high-precision images that adhere to the iconic characteristics of the product. This project aims to demonstrate the ability to build a targeted dataset, train a LoRA model, and achieve results consistent with the design and context of the product.
Objective
Dataset Structure
Dataset Organization
The dataset has been organized with a precise division of images:
Right shoe: 300 images
Left shoe: 300 images
Pair of shoes: 200 images
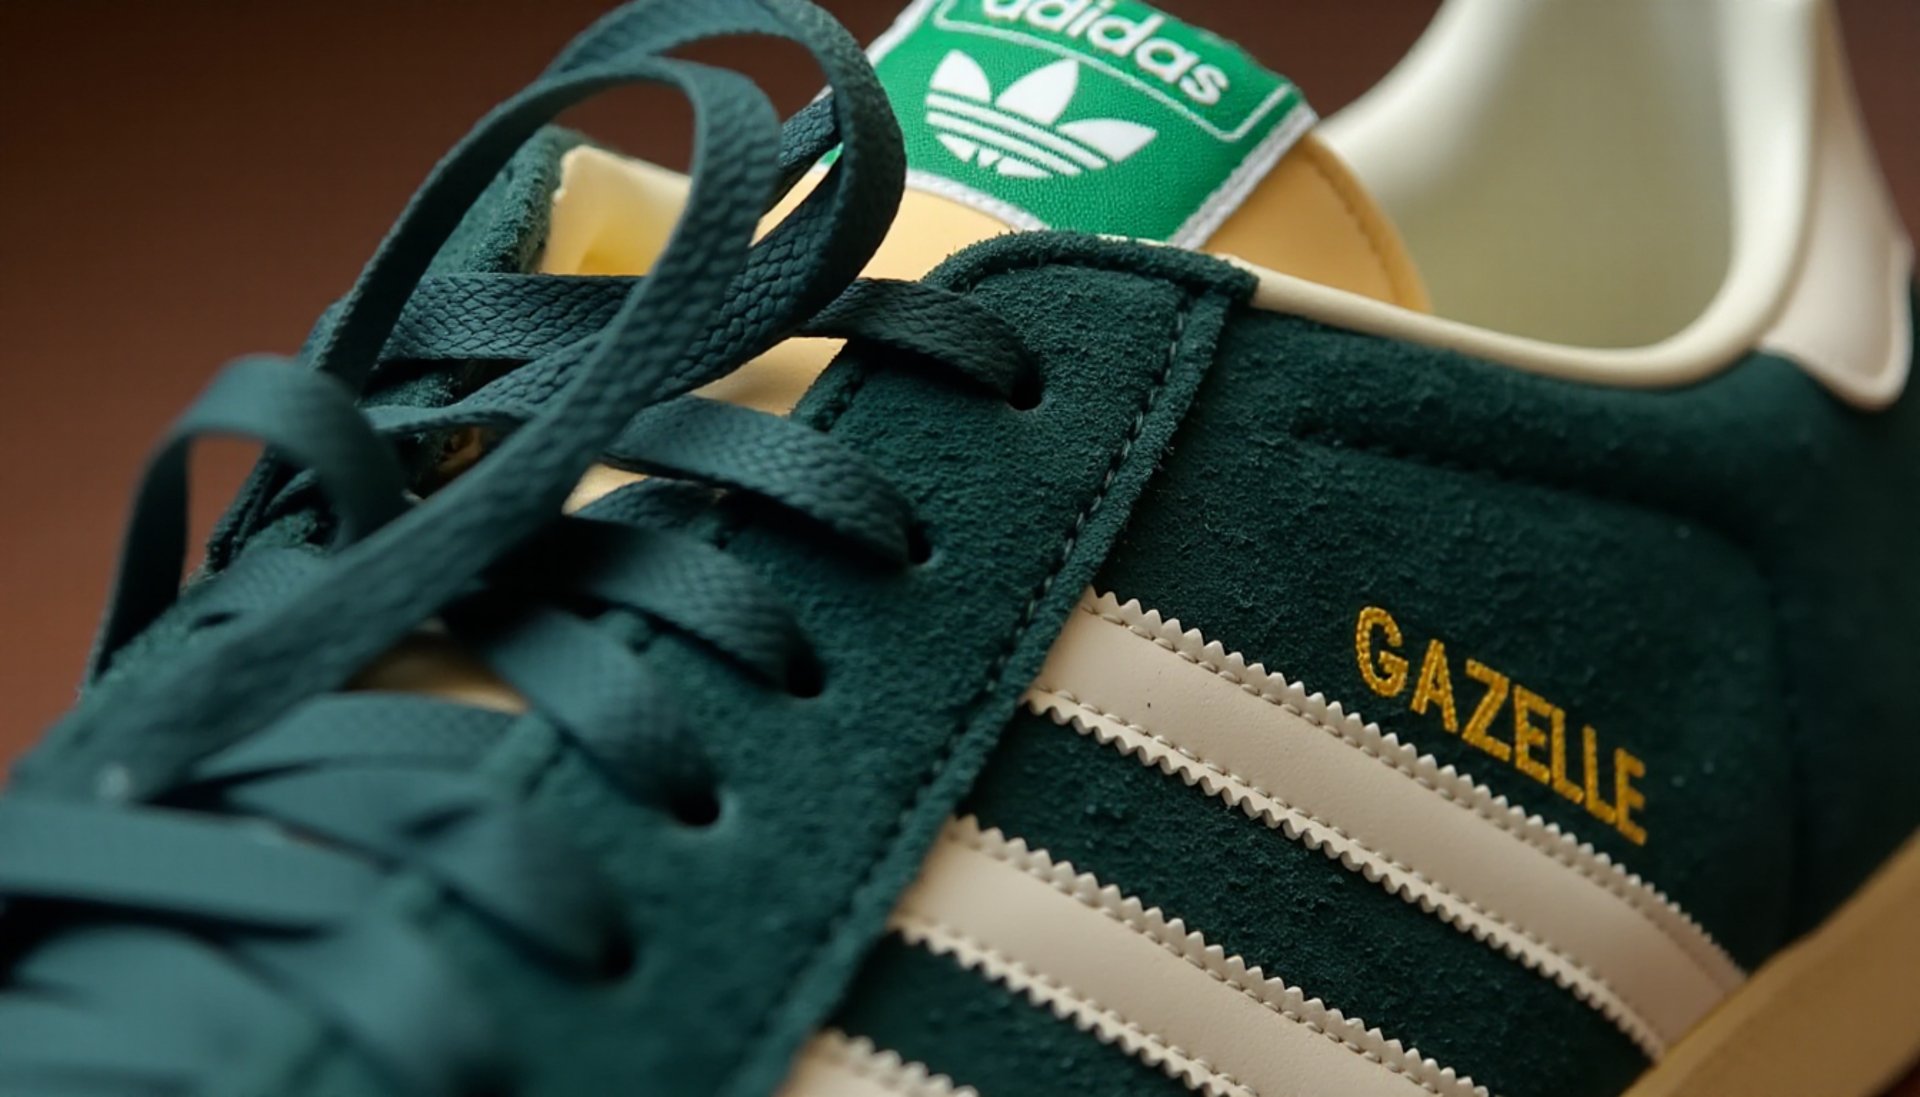
Close-up details: 50 images
Worn shoes: 50 images
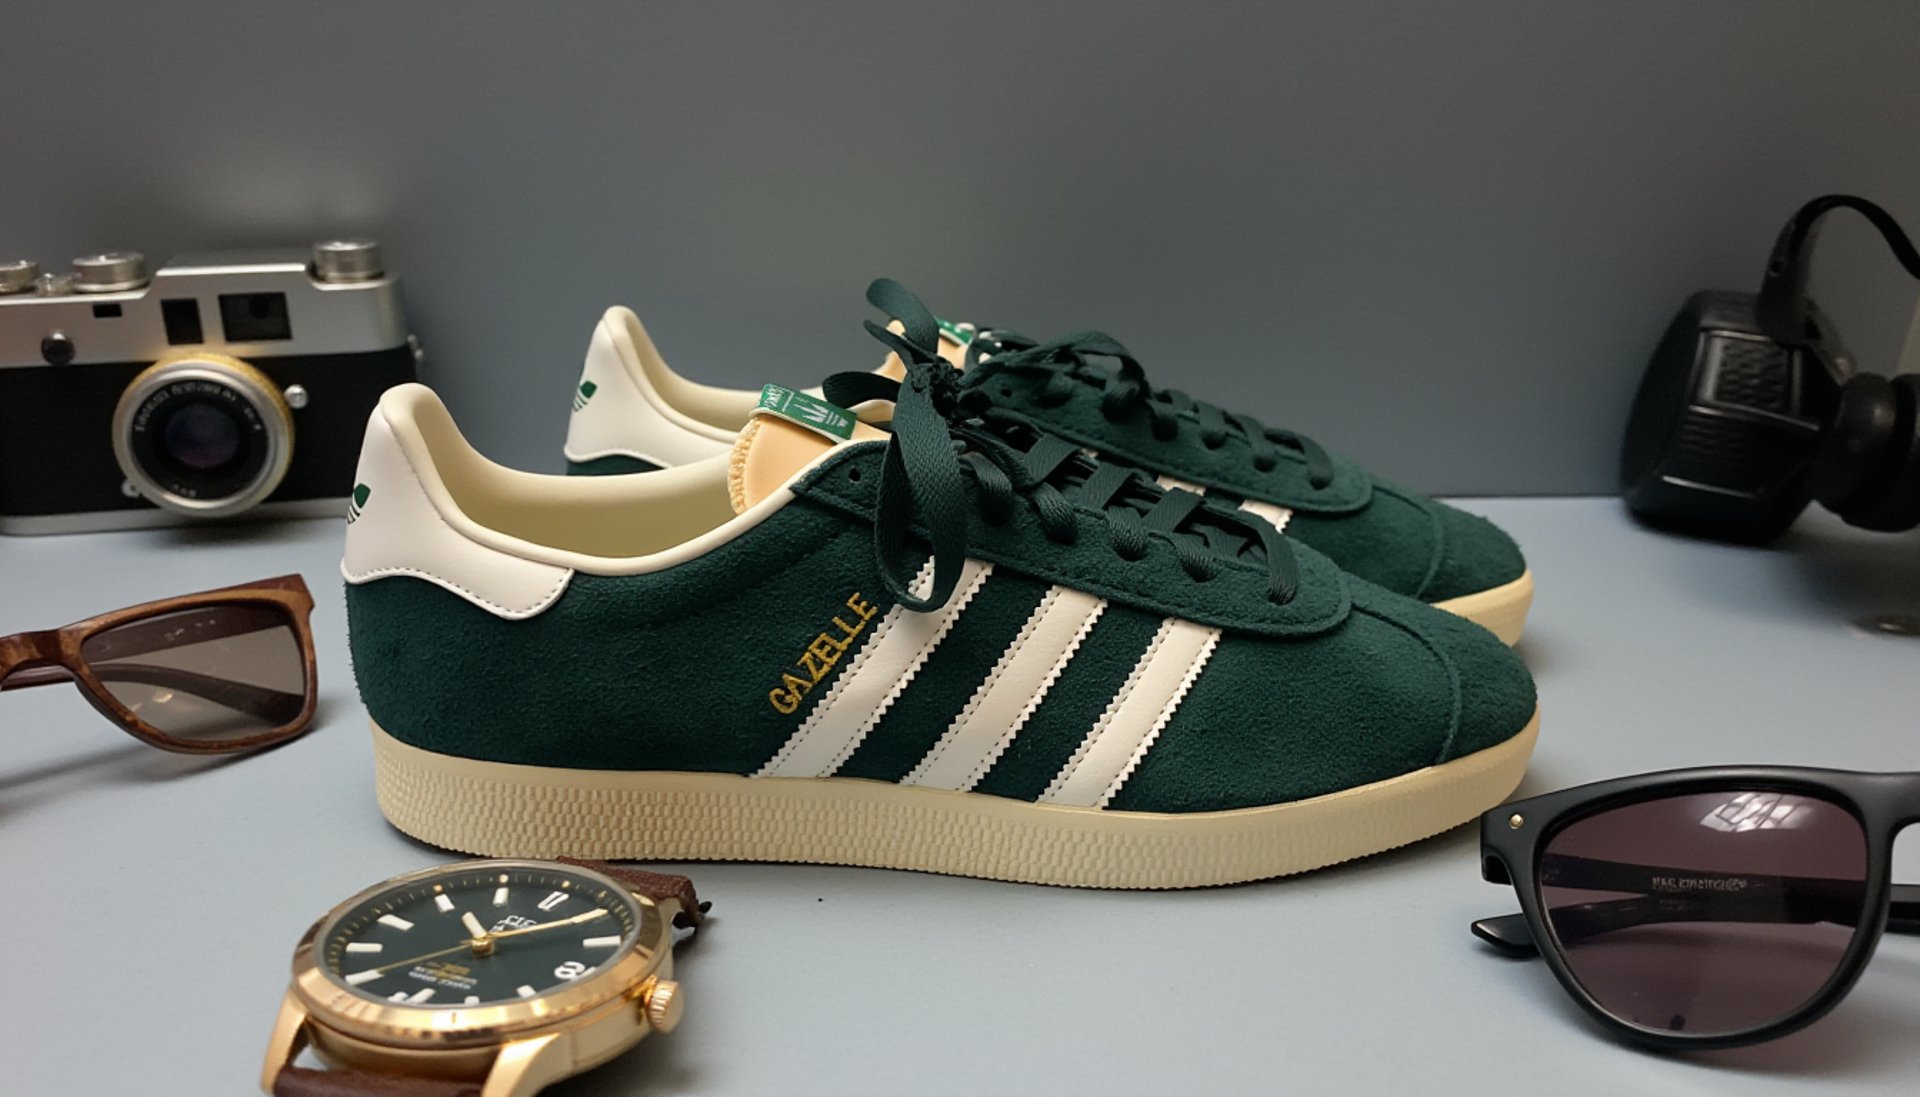
Shoes in hand: 50 images
This division ensures a comprehensive coverage of all angles, details, and contexts relevant to the product.
Proportions and Constraints
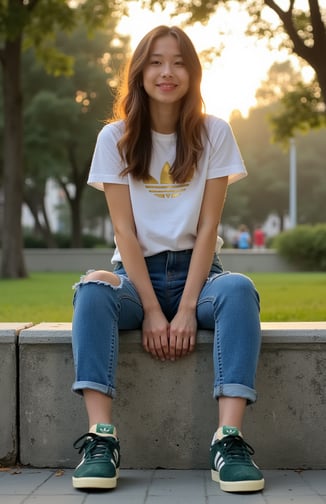
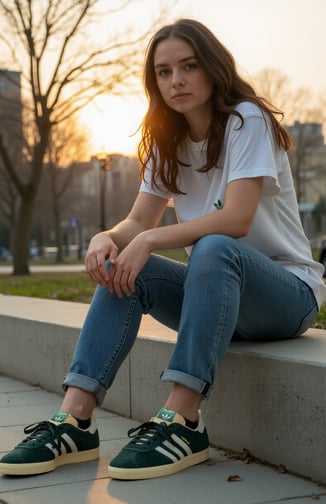
To maintain a balanced dataset and follow best practices, less than 20% of the images include elements beyond the shoes (e.g., hands or models wearing the shoes). This approach minimizes the risk of confusing the model during training.
Image Preparation
The photos were taken using:
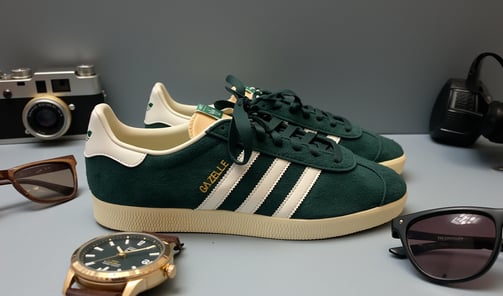
White background, later standardized in post-production to ensure consistency and visual cleanliness.
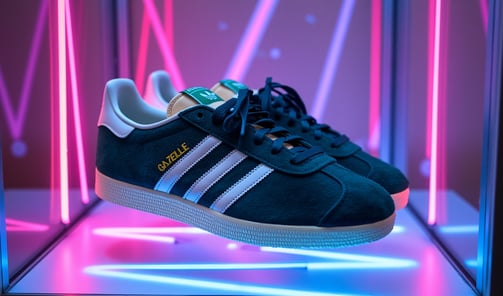
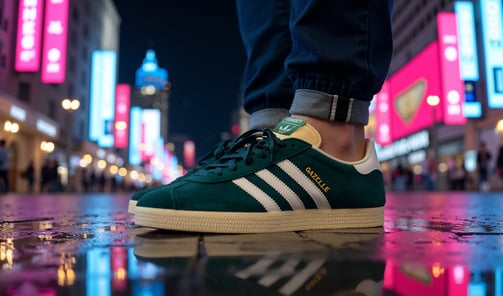
Alternative contexts: For the remaining 10%, including worn or held shoes, to improve the model's ability to generalize in realistic situations.
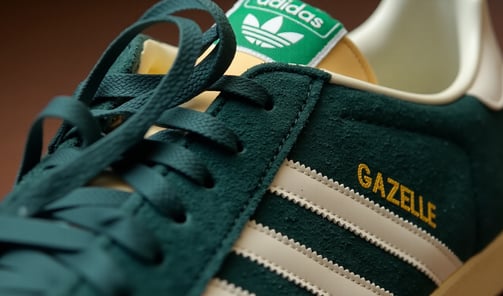
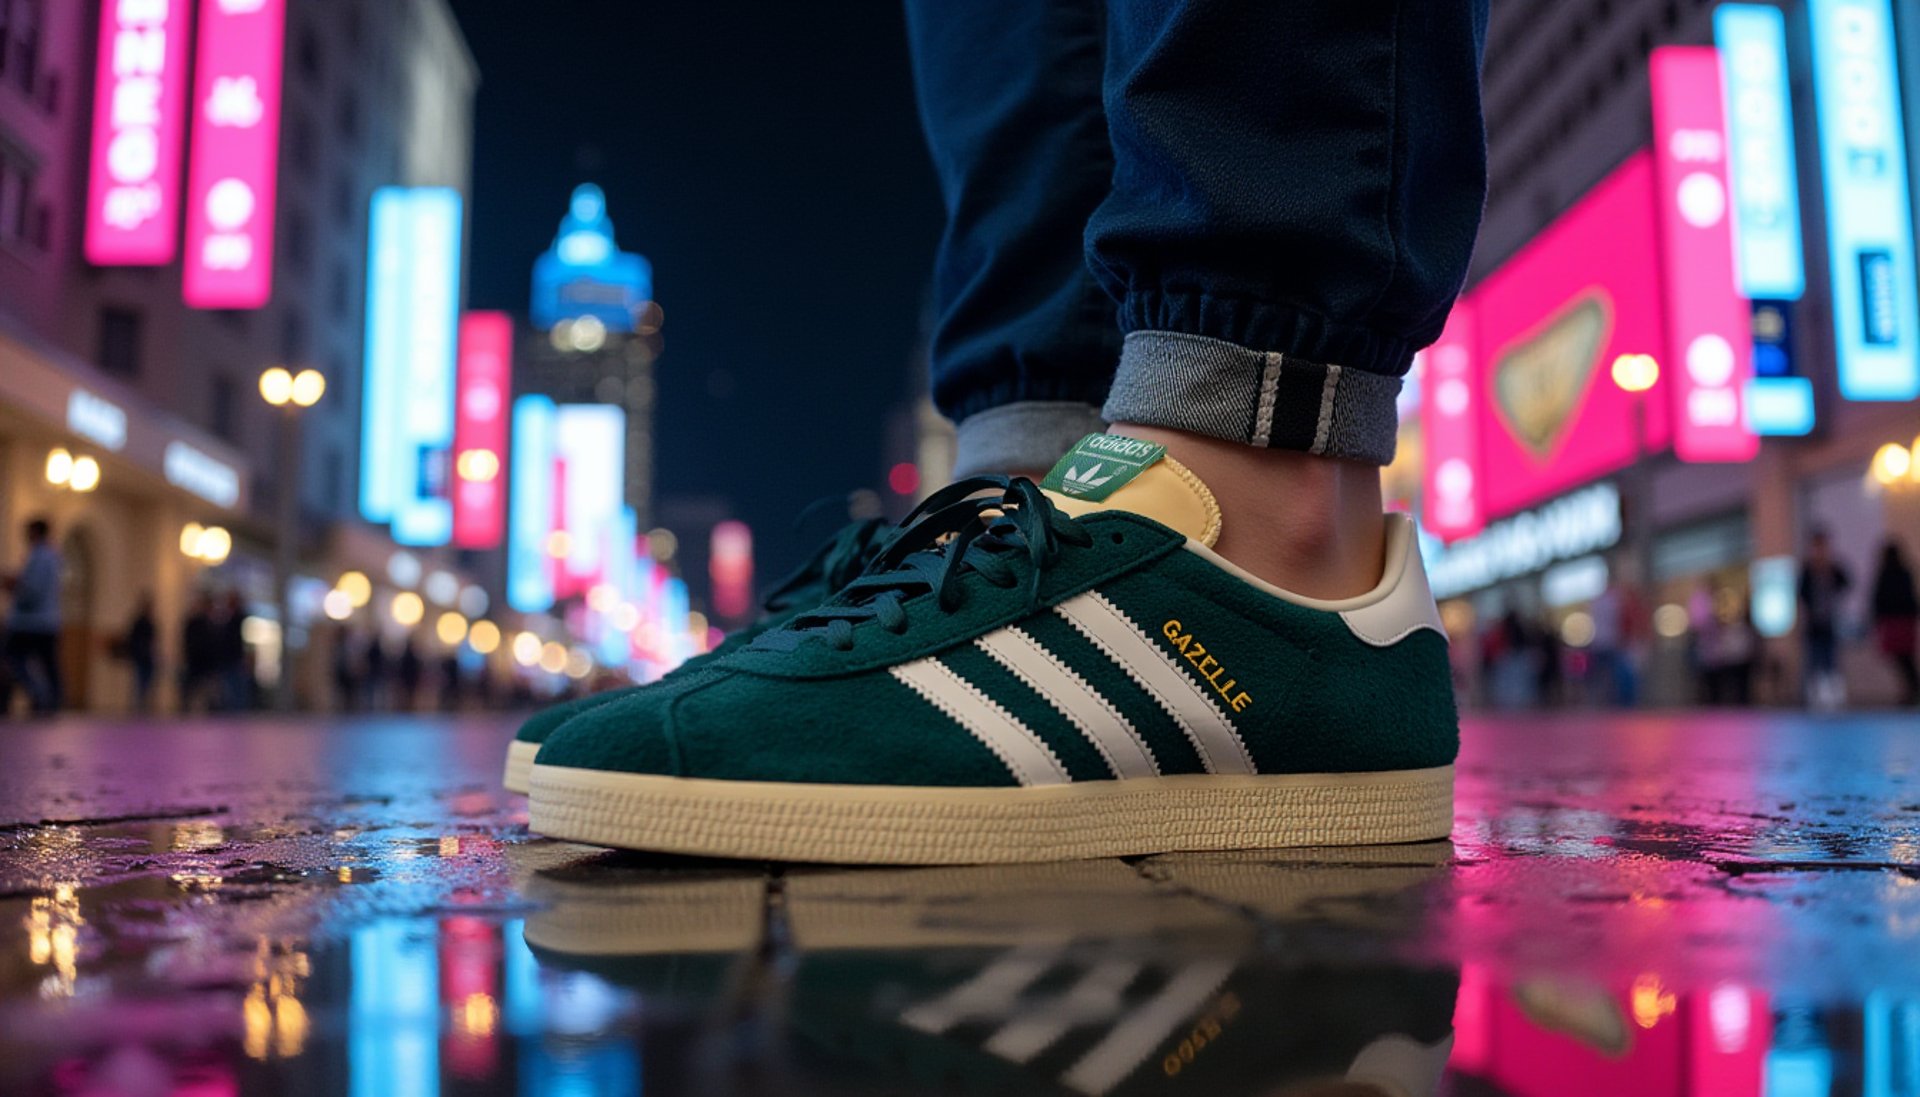
Although the base model was already trained on worn shoes, we included some images to ensure superior quality and specific adaptation to the product. Close-up images were added to improve the reproduction of distinctive elements such as the "Gazelle" logo and the texture of the suede fabric.
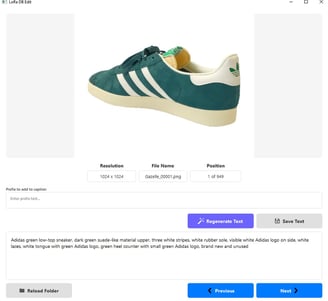
Creating Captions with LoraDBEditCaption Model
To complete the dataset, each image was annotated using the LoraDBEditCaption Model integrated into ComfyUI. This model automated the generation of captions, including:
Accurate descriptions consistent with the image content.
Prefixes and keywords specific to facilitate LoRA training.

Training Configuration
Total steps: 3500
Learning rate: 0.0001
Network dimensions: Dim = 64, Alpha = 64
Batch size: 1
Trigger word: "Green Gazelle"
Loss Evaluation with Graphs
During training, the loss was monitored through incremental saves at 500-step intervals. The collected data was used to plot graphs highlighting the loss trend over time.
In the first 1500 steps, the loss decreased rapidly, showing effective learning of the dataset's basic features.
Between 1500 and 2500 steps, the reduction of loss was more gradual, indicating a refinement phase.
After 2500 steps, the loss stabilized around optimal values, indicating that the model reached a good balance between accuracy and generalization.
Loss Graph
The graph below shows the reduction in loss during training:
X-axis: Number of steps (increments of 500).
Y-axis: Loss value.
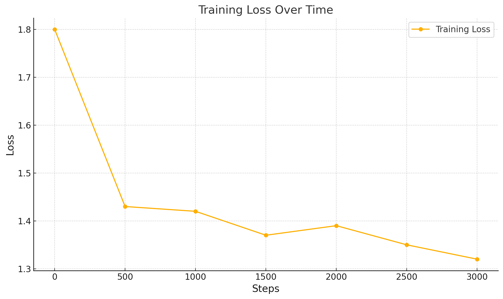
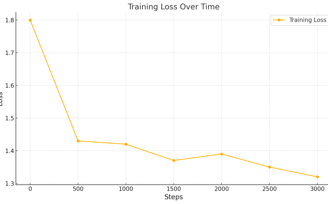
These data highlight a constant and progressive reduction in the loss, supporting the effectiveness of the training process.
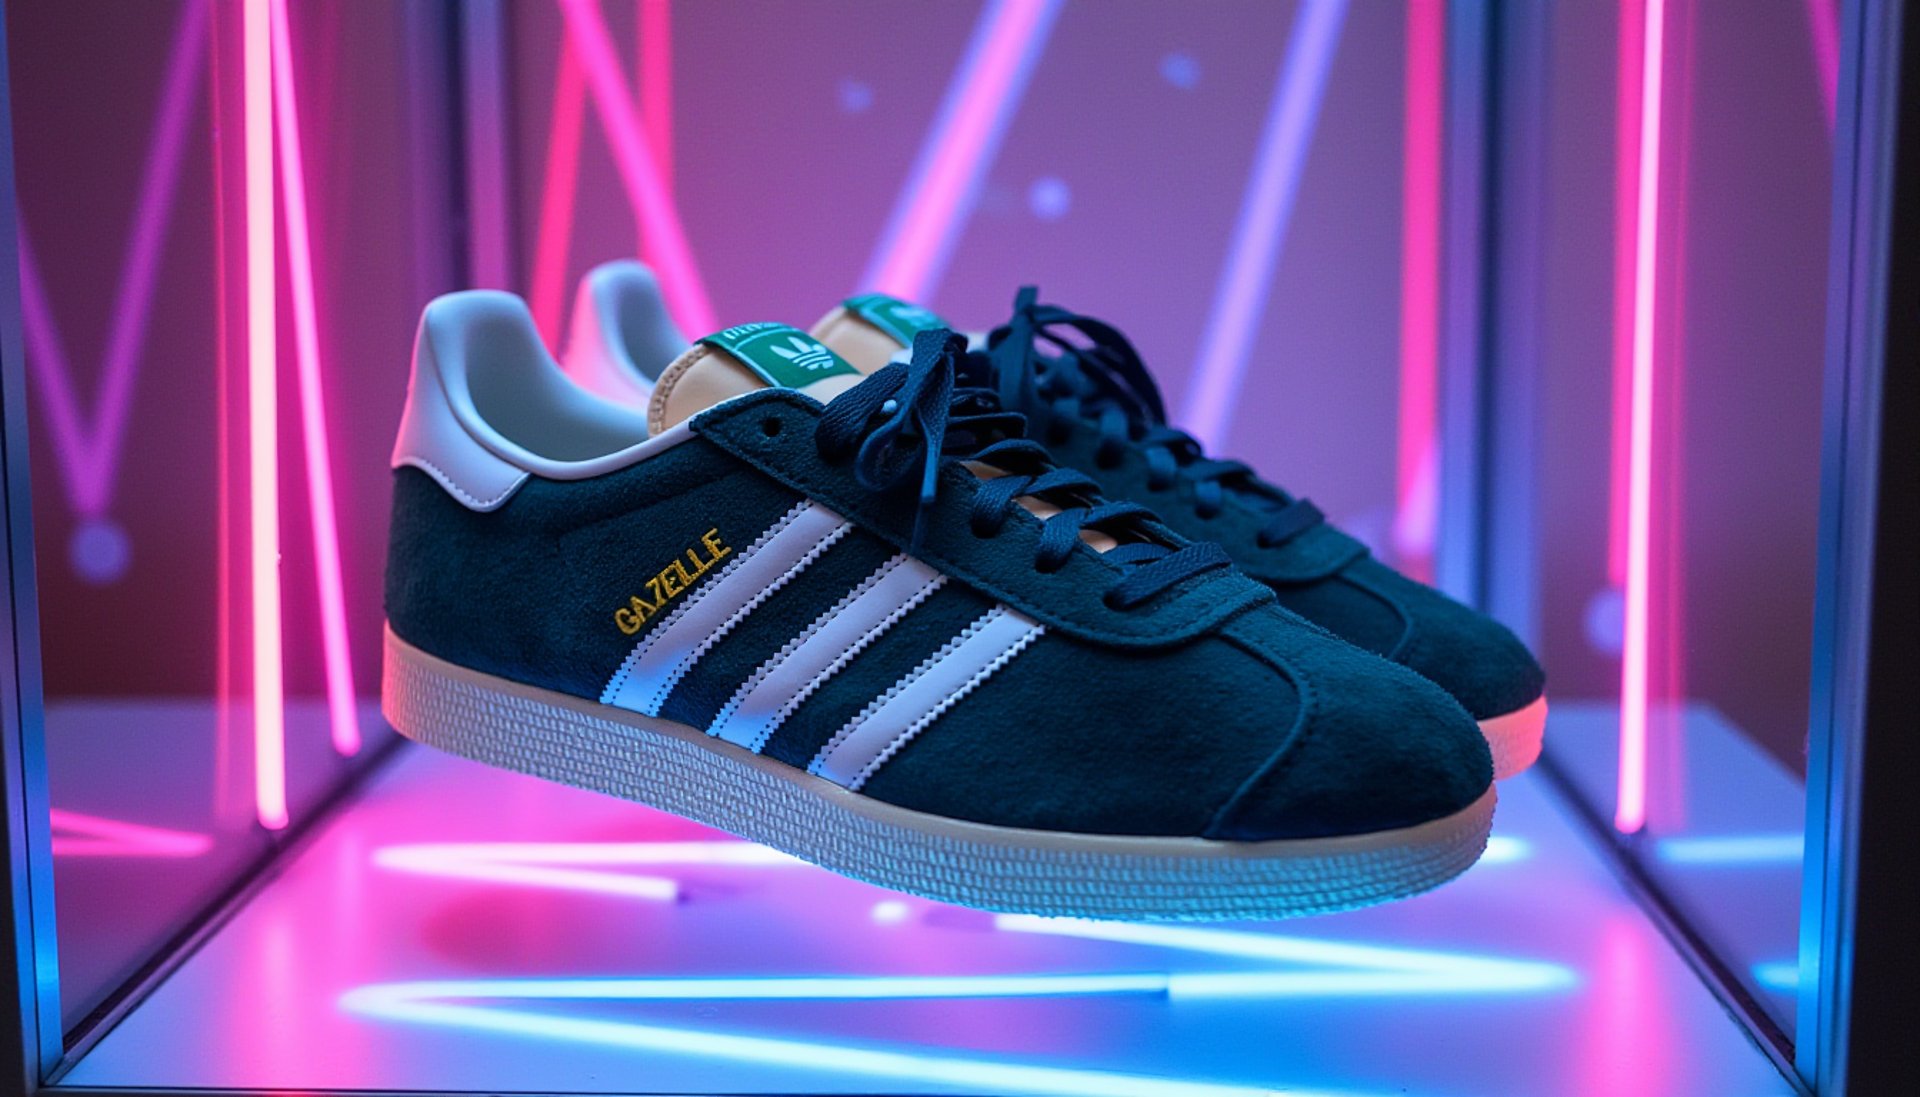
Model Testing
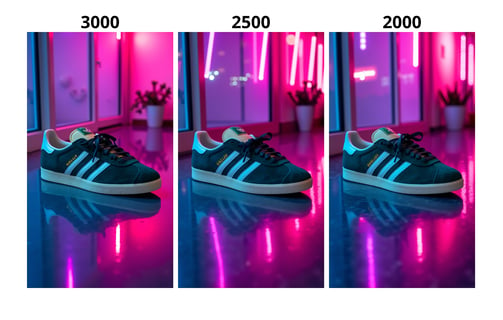
The models were tested by generating images with the same seed but on different models to compare the quality of training across various configurations. An additional test was conducted on the same model and seed, varying the LoRA strength to highlight the impact of this parameter on the results.
Results Analysis
The tests on the checkpoints revealed the following differences:
LoRA at 2000 steps: The details are less defined, with slight inconsistencies in the "GAZELLE" logo and less refined textures.
LoRA at 2500 steps: Significantly improved quality, with more precise details and a good reproduction of the textures.
LoRA at 3000 steps: Optimal quality, with sharp details and high fidelity to the original design, although there are some minor inaccuracies in the "GAZELLE" text.
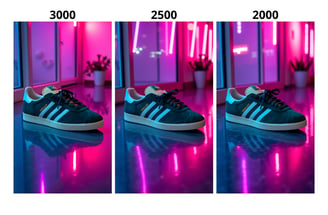
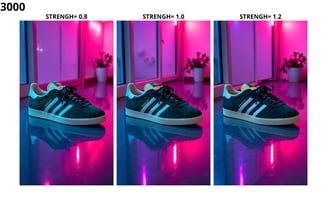
In addition, tests with different strength values on the 3000-step model provided further insights:
Strength = 0.8: The details appear softer, with the "GAZELLE" text less defined but consistent in positioning. Ideal for natural generations that integrate well with the base model.
Strength = 1.0: Provides the best balance between detail precision and fidelity to the original design. The text is visible, though not perfect.
Strength = 1.2: The details are highly pronounced, but the "GAZELLE" text starts to distort slightly, indicating potential local overfitting. Ideal for emphasizing specific textures.
These tests demonstrated that a strength value of 1.0 represents the best compromise for balanced generations.

Final Results